https://dl.dropboxusercontent.com/u/ic_bcn_1859/index.htm


This time I have geo-rectified, warped and geo-referenced a historical plan of the city of Barcelona, signed by Idelfonso Cerdà in April 1859. It is the Plan of the Reform and Expansion Project, in which you can see the famous grid-style or right-angled layout planned by Cerdà, that organised the design of the streets into angles creating a network of parallel and perpendicular streets, and the characteristic chamfered squares of buildings. The Plan has been fitted in such a way that its correspondence with a 2015 orthophoto can be checked. Since I have used Leaflet to design this web-map, I have embedded a horizontal slider, which facilitates the scrolling of the comparison image with the recent orthophoto. The central coordinates of the web-map are (in decimal degrees): 41.404047, 2.187780. For the geo-rectification I used 8 control points scattered around your map, with an approximate error of 15.0. Although my geo-rectification is not very accurate, usually high error is caused by a single point being misreferenced. In any case, the overall result is acceptable.

Programming a distance formula with Python


Fittingly for a creativity and imaginative solutions boffin such as me, I had the idea of programming with Python (version 3.10.2 in this case) this very simple program with which we obtain the distance 'D' to the horizon 'h'. All Python releases are Open Source, and programmers have voted by using Python enough that it's now the firs-ranked language in the world (see https://www.tiobe.com/tiobe-index/ for details). Only for both scientific and landscape minds, it's not difficult to suspect that the horizon is farther away as we go up, and that the sphericity of the Earth must have an influence. Therefore, by entering the value of the height at which we are, we will know how far away the horizon line is. The mathematical formula that defines it takes into account the radius of the Earth. The program can be called GAG_Dh.py, and run with Python IDLE (Python GUI), maybe already installed on your computer.

#This is my simple GAG_Dh program
print("___________________________\n")
print("Distance to the horizon line")
print("___________________________\n")
for i in [1,2,3,4,5,6,7,8,9,10]:
print("Write the height:", end = " ")
ob_height = float(input())
earth_r = 6371000
dist = (2 *ob_height * earth_r + ob_height **2)**0.5 #Formula
dist_km = int(dist * 0.001)
print("The horizon is at a distance of", dist_km, 'kms\n')
print("======= TRY AGAIN ========\n")

https://dl.dropboxusercontent.com/u/Nuredduna/index.htm


With the aim of making visible the urban virtues of certain circulatory axes in the city of Palma (Mallorca), I have created this web-map showing the route (in yellow) of the walking itinerary between the beginning of Nuredduna street and the peripheral neighbourhood of Son Ferriol (5.4 km length). Fortunately, Nuredduna street will be transformed into a pedestrian axis that will help to make Palma a resilient city with sustainable mobility. Nuredduna street is one of the urban axes that radially link the centre of the city with the suburbs –the sprawl–. The axis runs in a straight line beyond the torrent Gros (in the Balearic Islands, a torrent is a temporary stream of water), facilitating walking and cycling in this densely built-up and densely populated area of the city. The map uses the OpenLayers map library. The display of the different layers (Orthophotos, windmills, flood area, toponymy ...) can be controlled by the user through a layerswitcher (ol.control.LayerSwitcher). This layers control gives users the ability to switch between different base layers and switch overlays on/off.

https://dl.dropboxusercontent.com/u/7761445/hidrogeografic_mca.html


With the invaluable technical help of Leaflet map library and QGIS 3.12, I am preparing this interactive hydrogeographic map (a new web-map), which I hope will be useful when you want to quickly consult the water courses of the island of Mallorca, flood areas, and hydrogeological zones to which they belong. At the moment, the data for each watercourse is obtained by clicking on the points, but the intention is that they can be obtained by clicking on each line feature. Although I normally use the geospatial data exchange GeoJSON format, because it is lighter than the GML standard, sometimes the GeoJSON object is still very heavy (as in my case with the watercourse line layer). An alternative to reduce its size is to convert the file to TopoJSON.

https://dl.dropboxusercontent.com/u/5561453/alomar_1943.htm


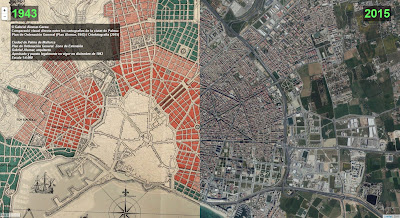
Here I have geo-rectified the Extension Plan of the city of Palma, approved on December, 1943, designed by the architect Gabriel Alomar Esteve, drawn on a scale of 1:4,000. Then I used Leaflet maps library to create a new interactive map to compare the city of Palma as it appears on an orthophoto of the year 2015 and the Alomar's plain.

https://dl.dropboxusercontent.com/u/8561407/sonbusquets.htm


Web-Map of interactive consultation of the urban area of Son Busquets (Palma), from different orthophotographic and topographic bases. As always, to program the web I used the Leaflet map library, adding a layer manager that includes cadastral cartography, Open Street Map and OSM Mapnik. I have exploited, through the TileLayer.WMS layer type, the Leaflet implementation of Web Map Service (WMS) services, an Open Geospatial Consortium (OGC) standard for publishing maps.

https://dl.dropboxusercontent.com/u/9563400/calvet_1901.htm


Here I have tried to test georeferencing map of the city of Palma, 1901. This is the plan of urban extension area of Palma approved on February 22, 1901, drafted by the engineer D. Bernardo Calvet, drawn on a scale of 1:4,000. The tipolithography is by Amengual y Muntaner. I also used Leaflet maps library to create a new interactive map to compare the city of Palma as it appears on an orthophoto of the year 2015 and the Calvet's plain. By the way, to facilitate interactive consultation, in this case I have added a horizontal slider (control deslizante) to the web map. Slider has a single handle that can be moved with the mouse.

https://dl.dropboxusercontent.com/u/2561405/togores_1850.htm


http://observatoriaigua.uib.es/copyleft/togores_1850.htm
Here I have tried to test georeferencing historical map of the city of Palma, 1850, authored by D. José Antonio Togores. I also used Leaflet maps library to create a new interactive map to compare the city of Palma as it appears on an orthophoto of the year 2015 and the Togores's map, dated 1850. Its original scale is 6.666 varas [ca. 1:12.700 using a metric scale]

https://dl.dropboxusercontent.com/u/9561405/font_1800.htm


In this case I have tried to test georeferencing historical map of the city of Palma, 1800, authored by Josef de Font (VºBº Bartholome Reynaud). I used Leaflet maps library to create a new interactive map to compare the city of Palma as it appears on an orthophoto of the year 2015 and the Josef de Font's map, dated on March 21, 1800. Its original scale is 1,000 varas, equivalent to a metric scale of 1:7,200.

https://dl.dropboxusercontent.com/u/9561405/LM_1831.htm


http://observatoriaigua.uib.es/copyleft/lm_1831.htm
Creating this web-map I have tried to test georeferencing historical map of the city of Palma, 1831, authored by Lorenzo Muntaner, using Map Warper. Then I used Leaflet maps library to create a new interactive map to compare the city of Palma as it appears on an orthophoto of the year 2012 and the Lorenzo Muntaner’s map.

https://dl.dropboxusercontent.com/u/9561405/1956-2012.htm


To build this web-map I used open source Leaflet maps library to compare interactively Mallorca territory as it appears on aerial photographs (now 'orthophotos' or 'orthoimages') of the years 1956 and 2012. The initial focal point of the map corresponds to a point in the center of Palma, but the territorial scope of the images covering the entire island.

https://dl.dropboxusercontent.com/u/9561405/Altures.html


Making this web-map I used the Google Maps API to integrate a very simple function: clicking on a point on the map, the height information at that location (elevation in meters Above Sea Level) is obtained. The base map is interchangeable: topography or satellite.

https://dl.dropboxusercontent.com/u/9561405/MtbMAP.htm


Web-maps not always show a satellite 'basemap’, but bases obtained from many different suppliers: OSM, Hydda, MapBox, ESRI, Stamen, HERE or CartoDB. In my case, my preferences range from the simplicity of OSM.B&W and colorful of MTBMap, although I think the aesthetic results are different depending on the scale we use. As an example, I used Leaflet to develop this web-map using MTBMap.